Pivot Points Standard w/ Future PivotsPivot Points Standard with Future Projections
This indicator displays traditional pivot point levels with an added feature to project future pivot levels based on the current period's price action.
Key Features:
Multiple Pivot Types: Choose from Traditional, Fibonacci, Woodie, Classic, DM, and Camarilla pivot calculations
Flexible Timeframes: Auto-detect or manually select Daily, Weekly, Monthly, Quarterly, Yearly, and multi-year periods
Future Pivot Projections: Visualize potential pivot levels for the next period based on current price movement
Custom Price Scenarios: Test "what-if" scenarios by entering a custom close price to see resulting pivot levels
Customizable Display: Adjust line styles, colors, opacity, and label positioning for both historical and future pivots
Historical Pivots: View up to 200 previous pivot periods for context
Future Pivot Options:
The unique future pivot feature calculates what the next period's support and resistance levels would be using the current period's High, Low, Open, and either the current price or a custom price you specify for the closing value. Future pivots are displayed with customizable line styles (solid, dashed, dotted) and opacity to distinguish them from historical levels.
Use Cases:
Plan entries and exits based on projected support/resistance
Scenario analysis with custom price targets
Identify key levels before the period closes
Multi-timeframe pivot analysis
Works on all timeframes and instruments.
Recherche dans les scripts pour "pivot points"


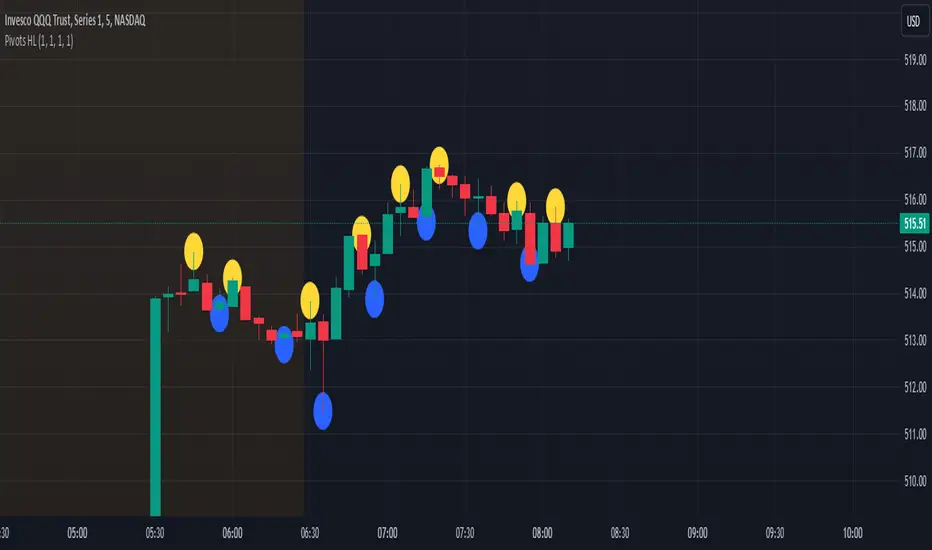
Chonky Pivot Pointsstandard pivot points re-written with circle plots.
Only shows the current pivot points. P, R1/R2, S1/S2
I don't use R3, R4 etc. so I didnt include them but feel free to modify the code.
You can change the resolution in indicator settings, default is set to Monthly.
Also to change the size of the circles all at once, you can input a number 1-4 in the inputs section.


Pivot Points by ParaticaPivot Points are very important for specially day traders. But Tradingview provides only monthly Pivot Points. You can check Pivot Points in any Chart Interval with this indicator.
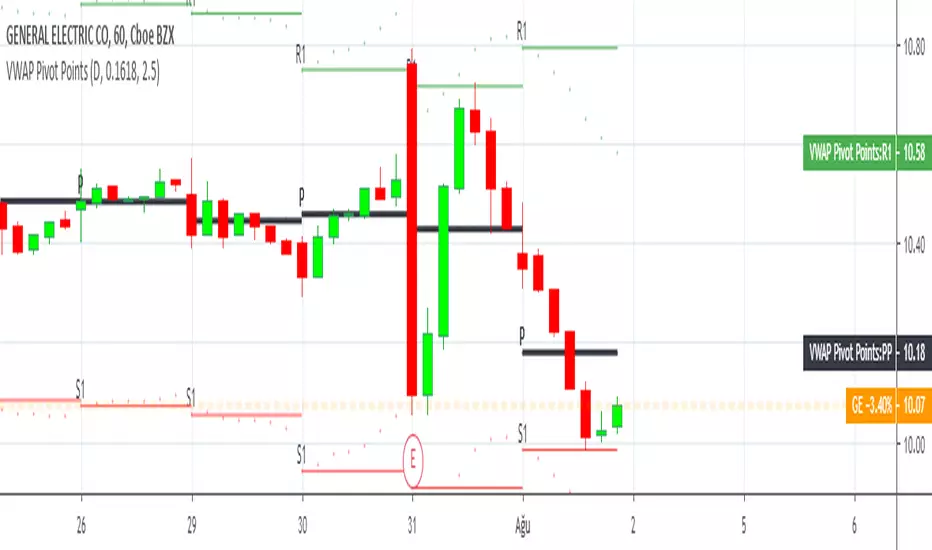
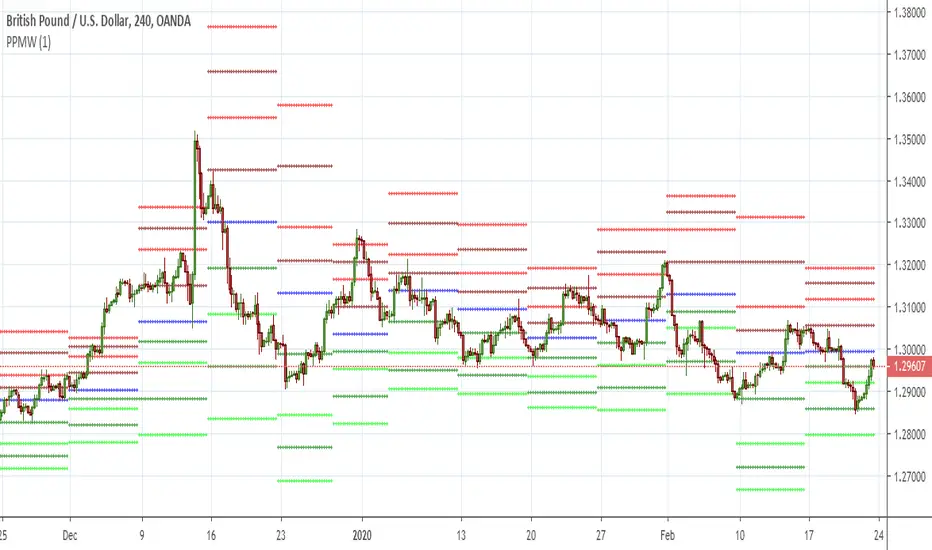
Pivot PointsPivot points are technical indicators used in financial markets (such as stocks, forex, or commodities) to identify potential turning points in price movement. They provide reference levels based on the previous day’s price action.
How to use the Pivot Points indicator
Traders use pivot points to identify significant price levels where the market may reverse or consolidate.
PP, S1, and R1 are considered primary levels, while S2 and R2 are secondary levels.
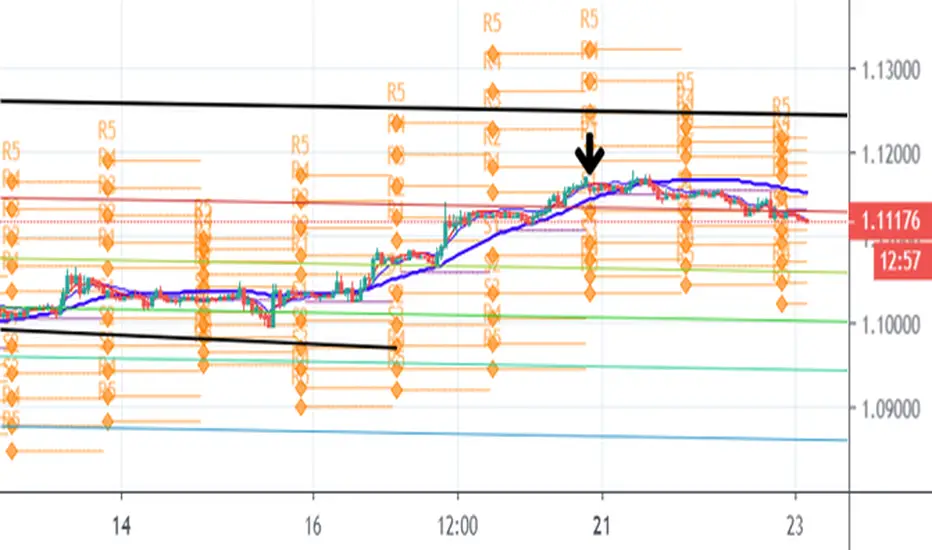
R3, R4, R5, S3, S4 and S5 are considered more extreme levels and we normally don't see price action trade near these levels on a typical day. This indicator calculates those extreme levels to help on days with extreme price action.
Pivot points can be calculated for different timeframes (daily, weekly, monthly, quarterly, 6-months and yearly).
Pivot points calculated using the daily timeframe is a popular chose among day traders traders who trade intraday timeframes.
Trading Strategies
Bounce Strategy:
Buy near support (S1 or S2) if the price bounces off these levels.
Sell near resistance (R1 or R2) if the price reverses from these levels.
Breakout Strategy:
If the price breaks above R1, consider a long position.
If the price breaks below S1, consider a short position.
Profit targets:
If in a long trade and price hits R1, you take some profit.
If in a short trade and price hits S1, you take some profit.
Combine pivot points with other technical indicators (e.g., moving averages, candlestick patterns) for confirmation. Remember that pivot points are just one tool among many, and their effectiveness varies across different markets and timeframes. Always practice risk management and consider the overall market context when using pivot points in your trading decisions.

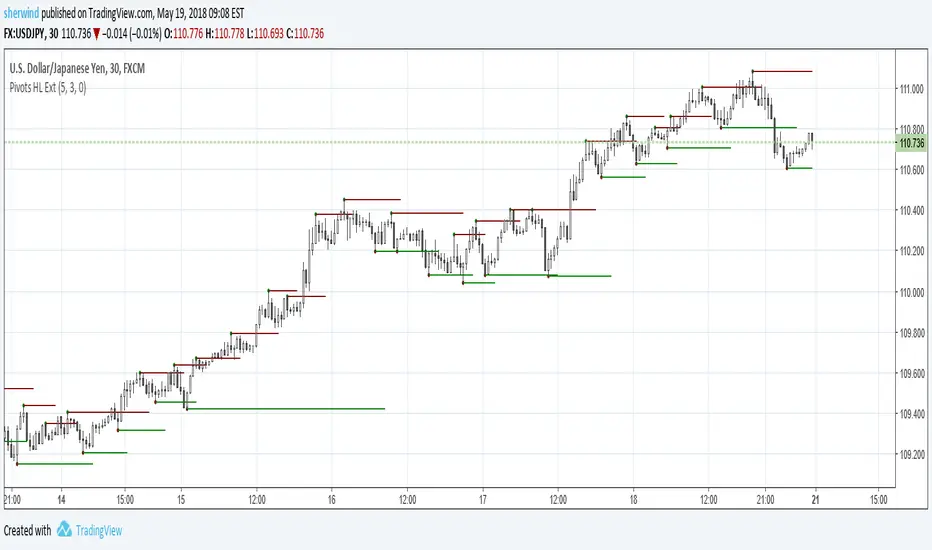
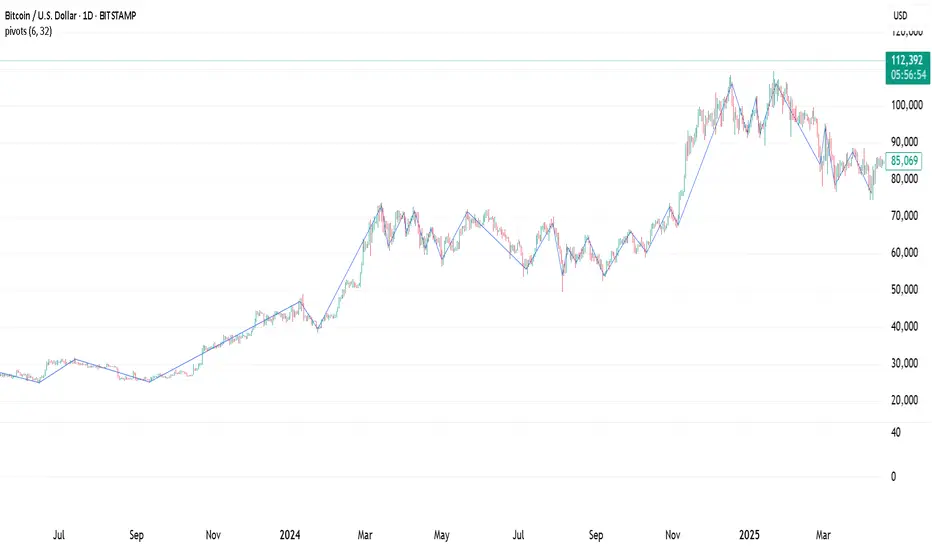
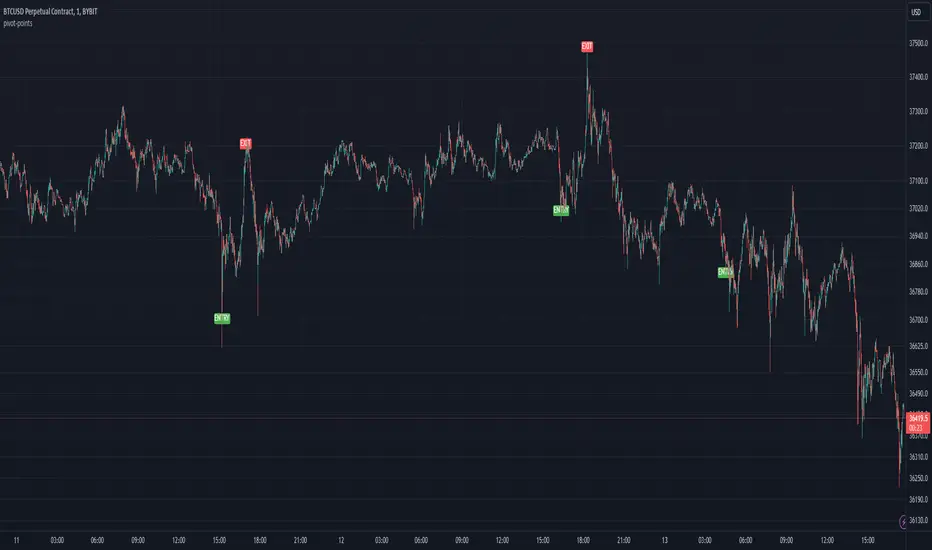
Pivot Points High Low & Missed Reversal Levels [LuxAlgo]Pivot Points High/Low, sometimes referred to as "Bar Count Reversals" allows highlighting market prices local tops and bottoms. This method compares the price value at a certain index within a user-specified window length and tests whether it is the highest (pivot high) or lowest (pivot low).
This method can return successive pivots of the same type, thus missing certain reversals, as such, we aimed to highlight those missed reversals and provide a level at their location to determine if they had any significant role to play. A zig-zag is additionally built, connecting regular pivots with missed reversals.
Settings
Pivot Length: Determine the "Bar Count Reversals" window size. higher values will highlight more significant reversals.
Other settings control the look of the displayed graphical elements within the indicator.
Usage
Missed reversals are highlighted by labels with a ghost emoji, a Zig-Zag line connecting a missed reversal is dashed. Note that labels are offset by -Pivot Length bars (with the exception of the most recent one), and as such are detected further ahead of their location.
When a missed reversal is detected, a level is displayed, starting at the location of the missed reversal and ending when a new missed reversal is detected.
These levels can be used as support and resistance.
The most recent label estimates the possible location of a confirmed reversal, and will continuously readjust whether price makes a new higher high/lower low depending on the type of previously detected pivot. A level is also made out of this estimated reversal.

Pivot Points High Low ExtensionPivot Points High Low Extension
See Also:
- A Simple 1-2-3 Method for Trading Forex
- The Classic 1-2-3 Pattern: An Underestimated Powerhouse
- Bulkowski's 1-2-3 Trend Change
Pivot Points LIVE [CHE]Title:
Pivot Points LIVE Indicator
Subtitle:
Advanced Pivot Point Analysis for Real-Time Trading
Presented by:
Chervolino
Date:
September 24, 2024
Introduction
What are Pivot Points?
Definition:
Pivot Points are technical analysis indicators used to determine potential support and resistance levels in financial markets.
Purpose:
They help traders identify possible price reversal points and make informed trading decisions.
Overview of Pivot Points LIVE :
A comprehensive indicator designed for real-time pivot point analysis.
Offers advanced features for enhanced trading strategies.
Key Features
Pivot Points LIVE Includes:
Dynamic Pivot Highs and Lows:
Automatically detects and plots pivot high (HH, LH) and pivot low (HL, LL) points.
Customizable Visualization:
Multiple options to display markers, price labels, and support/resistance levels.
Fractal Breakouts:
Identifies and marks breakout and breakdown events with symbols.
Line Connection Modes:
Choose between "All Separate" or "Sequential" modes for connecting pivot points.
Pivot Extension Lines:
Extends lines from the latest pivot point to the current bar for trend analysis.
Alerts:
Configurable alerts for breakout and breakdown events.
Inputs and Configuration
Grouping Inputs for Easy Customization:
Source / Length Left / Length Right:
Pivot High Source: High price by default.
Pivot Low Source: Low price by default.
Left and Right Lengths: Define the number of bars to the left and right for pivot detection.
Colors: Customizable colors for pivot high and low markers.
Options:
Display Settings:
Show HH, LL, LH, HL markers and price labels.
Display support/resistance level extensions.
Option to show levels as a fractal chaos channel.
Enable fractal breakout/down symbols.
Line Connection Mode:
Choose between "All Separate" or "Sequential" for connecting lines.
Line Management:
Set maximum number of lines to display.
Customize line colors, widths, and styles.
Pivot Extension Line:
Visibility: Toggle the display of the last pivot extension line.
Customization: Colors, styles, and width for extension lines.
How It Works - Calculating Pivot Points
Pivot High and Pivot Low Detection:
Pivot High (PH):
Identified when a high price is higher than a specified number of bars to its left and right.
Pivot Low (PL):
Identified when a low price is lower than a specified number of bars to its left and right.
Higher Highs, Lower Highs, Higher Lows, Lower Lows:
Higher High (HH): Current PH is higher than the previous PH.
Lower High (LH): Current PH is lower than the previous PH.
Higher Low (HL): Current PL is higher than the previous PL.
Lower Low (LL): Current PL is lower than the previous PL.
Visual Elements
Markers and Labels:
Shapes:
HH and LH: Downward triangles above the bar.
HL and LL: Upward triangles below the bar.
Labels:
Optionally display the price levels of HH, LH, HL, and LL on the chart.
Support and Resistance Levels:
Extensions:
Lines extending from pivot points to indicate potential support and resistance zones.
Chaos Channels:
Display levels as a fractal chaos channel for enhanced trend analysis.
Fractal Breakout Symbols:
Buy Signals: Upward triangles below the bar.
Sell Signals: Downward triangles above the bar.
Slide 7: Line Connection Modes
All Separate Mode:
Description:
Connects pivot highs with pivot highs and pivot lows with pivot lows separately.
Use Case:
Ideal for traders who want to analyze highs and lows independently.
Sequential Mode:
Description:
Connects all pivot points in the order they occur, regardless of being high or low.
Use Case:
Suitable for identifying overall trend direction and momentum.
Pivot Extension Lines
Purpose:
Trend Continuation:
Visualize the continuation of the latest pivot point's price level.
Customization:
Colors:
Differentiate between bullish and bearish extensions.
Styles:
Solid, dashed, or dotted lines based on user preference.
Width:
Adjustable line thickness for better visibility.
Dynamic Updates:
The extension line updates in real-time as new bars form, providing ongoing trend insights.
Alerts and Notifications
Configurable Alerts:
Fractal Break Arrow:
Triggered when a breakout or breakdown occurs.
Long and Short Signals:
Specific alerts for bullish breakouts (Long) and bearish breakdowns (Short).
Benefits:
Timely Notifications:
Stay informed of critical market movements without constant monitoring.
Automated Trading Strategies:
Integrate with trading bots or automated systems for executing trades based on alerts.
Customization and Optimization
User-Friendly Inputs:
Adjustable Parameters:
Tailor pivot detection sensitivity with left and right lengths.
Color and Style Settings:
Match the indicator aesthetics to personal or platform preferences.
Line Management:
Maximum Lines Displayed:
Prevent chart clutter by limiting the number of lines.
Dynamic Line Handling:
Automatically manage and delete old lines to maintain chart clarity.
Flexibility:
Adapt to Different Markets:
Suitable for various financial instruments including stocks, forex, and cryptocurrencies.
Scalability:
Efficiently handles up to 500 labels and 100 lines for comprehensive analysis.
Practical Use Cases
Identifying Key Support and Resistance:
Entry and Exit Points:
Use pivot levels to determine optimal trade entry and exit points.
Trend Confirmation:
Validate market trends through the connection of pivot points.
Breakout and Breakdown Strategies:
Trading Breakouts:
Enter long positions when price breaks above pivot highs.
Trading Breakdowns:
Enter short positions when price breaks below pivot lows.
Risk Management:
Setting Stop-Loss and Take-Profit Levels:
Utilize pivot levels to place strategic stop-loss and take-profit orders.
Slide 12: Benefits for Traders
Real-Time Analysis:
Provides up-to-date pivot points for timely decision-making.
Enhanced Visualization:
Clear markers and lines improve chart readability and analysis efficiency.
Customizable and Flexible:
Adapt the indicator to fit various trading styles and strategies.
Automated Alerts:
Stay ahead with instant notifications on key market events.
Comprehensive Toolset:
Combines pivot points with fractal analysis for deeper market insights.
Conclusion
Pivot Points LIVE is a robust and versatile indicator designed to enhance your trading strategy through real-time pivot point analysis. With its advanced features, customizable settings, and automated alerts, it equips traders with the tools needed to identify key market levels, execute timely trades, and manage risks effectively.
Ready to Elevate Your Trading?
Explore Pivot Points LIVE and integrate it into your trading toolkit today!
Q&A
Questions?
Feel free to ask any questions or request further demonstrations of the Pivot Points LIVE indicator.

Pivot Points. High & Lows By Reversal PercentageLibrary "Pivot Points. High & Lows By Reversal Percentage" by Jal9000
This Pine Script library provides a robust function for identifying and tracking pivot points (reversal points) in price data, suitable for integration into custom trading indicators and strategies.
🛠️ Main Features:
- ✅ Identifies pivot highs and lows based on configurable price movement thresholds.
- ✅ Lightweight. No candle backtracing used. Much less computation heavy.
- ✅ Supports multiple calls (with different values) within a single script.
- ✅ Compatible with request.security for multi-timeframe analysis.
- ✅ Returns both confirmed and temporary pivots for flexible integration.
- ✅ Pinescript V5 and V6 compliant code.
Purpose:
The pivots library enables Pine Script developers to easily add pivot point detection to their scripts. It identifies significant price reversals by evaluating price movements against a minimum range threshold ( min_range_pct ) and confirming reversals based on a percentage ( reversal_pct ) of the prior trend’s magnitude. The library supports multiple simultaneous calls with different settings, making it ideal for multi-timeframe strategies.
How It Works:
The library’s f_calculatePivot function tracks price movements to detect pivot points:
Minimum Range Threshold : A potential pivot is considered if the price moves beyond the min_range_pct percentage of the current high (for a high pivot) or low (for a low pivot), ensuring sufficient movement.
Reversal Confirmation : A pivot is confirmed if the price reverses from the potential pivot by at least the reversal_pct percentage of the distance between the last confirmed pivot and the current potential pivot, measuring the retracement relative to the prior trend’s magnitude.
The function alternates between tracking highs (in an uptrend) and lows (in a downtrend), updating the trend when a pivot is confirmed.
State management uses an array of pivot_state objects, allowing independent calculations for different timeframes and min_range_pct values within the same script.
## Technical Reference
Functions:
f_calculatePivot(series float _high, series float _low, float _min_range_pct, float _reversal_pct) →
- Parameters:
_high : The high price series (e.g., high or math.max(open, close) ).
_low : The low price series (e.g., low or math.min(open, close) ).
_min_range_pct : The minimum percentage price movement to consider a potential pivot.
_reversal_pct : The percentage of the prior trend’s distance required to confirm a pivot.
- Returns:
A tuple containing:
isNewPivot : Boolean indicating if a new pivot was confirmed.
last_confirmed_pivot : The most recent confirmed pivot (type pivot ).
temp_pivot : The current temporary pivot (type pivot ).
Pivot type:
idx (series int) : Bar index of the pivot.
typ (series int) : Type of pivot ( PIVOT_HIGH or PIVOT_LOW ).
prc (series float) : Price of the pivot.
tme (series int) : Timestamp of the pivot.
Constants (internal):
TREND_LONG , TREND_SHORT : Trend direction indicators (1, -1).
PIVOT_HIGH , PIVOT_LOW : Pivot type indicators (1, -1).
✨ Example of Use:
//@version=5
indicator("Pivot Example", overlay=true)
import jal9000/pivots/1 as pivots
// Inputs
min_range_pct = input.float(20.0, 'Min Range %')
reversal_pct = input.float(30.0, 'Reversal %')
ignore_wick = input.bool(true, 'Ignore wick')
h = ignore_wick ? math.max(open, close) : high
l = ignore_wick ? math.min(open, close) : low
// Call the function with high, low, and input parameters
= pivots.f_calculatePivot(h, l, min_range_pct, reversal_pct)
// Variable to store previous confirmed pivot outside the function
var pivots.pivot prev_confirmed_pivot = na
// Draw the line if a new pivot is confirmed and previous pivot exists
if is_new_pivot
if not na(prev_confirmed_pivot) and not na(new_confirmed_pivot)
line.new(x1 = prev_confirmed_pivot.idx, y1 = prev_confirmed_pivot.prc, x2 = new_confirmed_pivot.idx, y2 = new_confirmed_pivot.prc, color = color.blue, width = 1)
prev_confirmed_pivot := new_confirmed_pivot
## Release Notes
v1
- Initial release of the pivots library with f_calculatePivot function for detecting pivot points and supporting multiple configurations and timeframes.
v2
- Code is Pinescript V6 ready. Remains identified as V5, but changing the version number is the only thing that is required to be v6.
Pivot Points + Day First Candle Breakout + VWAP + Supertrend This indicator amalgamates several key indicators to provide a comprehensive analysis for trading decisions, including SuperTrend, Pivot Points, VWAP, along with the Day First Candle Breakout strategy.
Key Features:
Day First Candle Breakout: Identifies potential breakout opportunities based on the first candle of the trading day. It utilizes the high and low of the initial trading range to determine entry points.
Timeframe Selection: Allows users to select the timeframe for analyzing the first candle (e.g., 5, 15, or 60 minutes).
Previous Day and Week High/Low: Displays the high and low of the previous day and week to provide additional context for trading decisions and assess the strength of the trend.
Trend Strength Analysis: Indicates whether the current price is above or below the previous day's high or low, signaling a stronger bullish or bearish trend respectively.
SuperTrend Indicator: Visualizes the trend direction and potential reversal points based on the SuperTrend indicator. It helps traders to stay aligned with the prevailing trend and avoid premature exits.
Pivot Points: Presents key support and resistance levels derived from Pivot Points, assisting traders in identifying potential reversal or breakout zones.
VWAP (Volume Weighted Average Price): Plots VWAP to provide insight into the average price traded over a given period, aiding in determining the fair value of the asset and potential buying/selling zones.
Trading Signals:
Buy Signal: Triggered when the price exceeds the high of the initial trading range after an upward price gap.
Sell Signal: Generated when the price falls below the low of the initial trading range after a downward price gap.
Caveats for Effective Trading:
Extended Trading Ranges: Adjusts support and resistance levels if the initial trading range extends beyond the defined timeframe.
Morning Noise Consideration: Exercises caution during volatile morning sessions to avoid false breakouts and whipsaws.
Pullbacks and Narrow Range Bars: Looks for opportunities during pullbacks or when the price forms narrow range bars to enter trades, reducing the risk of sudden reversals.

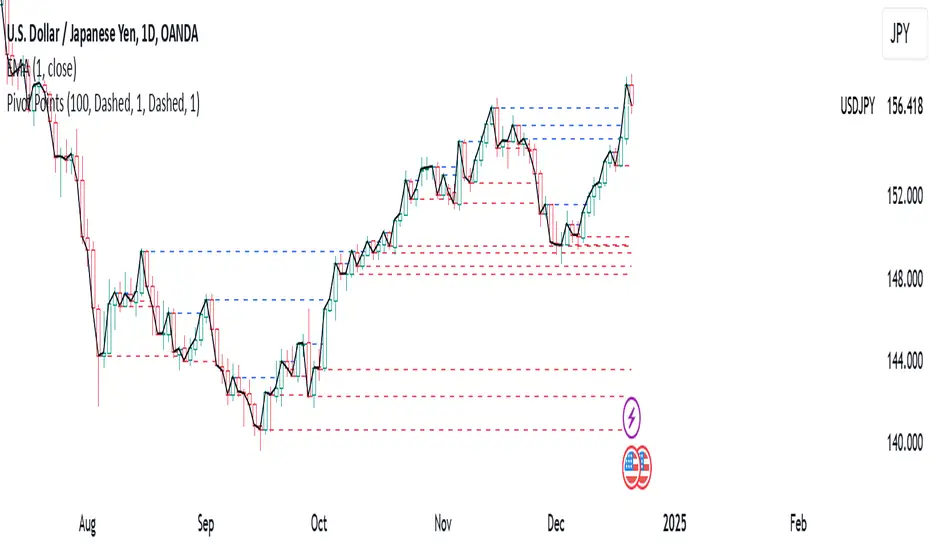
Pivot Points Level [TradingFinder] 4 Methods + Reversal lines🔵 Introduction
"Pivot Points" are places on the price chart where buyers and sellers are most active. Pivot points are calculated based on the previous day's price data and serve as reference points for traders to make decisions.
Types of Pivot Points :
Floor
Woodie
Camarilla
Fibonacci
🟣 Floor Pivot Points
Floor pivot points are widely used in technical analysis. The central pivot point (PP) serves as the main level of support or resistance, indicating the potential direction of the trend.
The first to third levels of resistance (R1, R2, R3) and support (S1, S2, S3) provide additional signals for potential trend reversals or continuations.
Floor Pivot Points Formula :
Pivot Point (PP): (H + L + C) / 3
First Resistance (R1): (2 * P) - L
Second Resistance (R2): P + H - L
Third Resistance (R3): H + 2 * (P - L)
First Support (S1): (2 * P) - H
Second Support (S2): P - H + L
Third Support (S3): L - 2 * (H - P)
🟣 Camarilla Pivot Points
Camarilla pivot points include eight levels that closely align with support and resistance. These points are particularly useful for setting stop-loss and profit targets.
Camarilla Pivot Points Formula :
Fourth Resistance (R4): (H - L) * 1.1 / 2 + C
Third Resistance (R3): (H - L) * 1.1 / 4 + C
Second Resistance (R2): (H - L) * 1.1 / 6 + C
First Resistance (R1): (H - L) * 1.1 / 12 + C
First Support (S1): C - (H - L) * 1.1 / 12
Second Support (S2): C - (H - L) * 1.1 / 6
Third Support (S3): C - (H - L) * 1.1 / 4
Fourth Support (S4): C - (H - L) * 1.1 / 2
🟣 Woodie Pivot Points
Woodie pivot points are similar to floor pivot points but place more emphasis on the closing price. This method often results in different pivot levels than the floor method.
Woodie Pivot Points Formula :
Pivot Point (PP): (H + L + 2 * C) / 4
First Resistance (R1): (2 * P) - L
Second Resistance (R2): P + H - L
First Support (S1): (2 * P) - H
Second Support (S2): P - H + L
🟣 Fibonacci Pivot Points
Fibonacci pivot points use the standard floor pivot points and then apply Fibonacci retracement levels to the range of the previous trading period. The common retracement levels used are 38.2%, 61.8%, and 100%.
Fibonacci Pivot Points Formula :
Pivot Point (PP): (H + L + C) / 3
Third Resistance (R3): PP + ((H - L) * 1.000)
Second Resistance (R2): PP + ((H - L) * 0.618)
First Resistance (R1): PP + ((H - L) * 0.382)
First Support (S1): PP - ((H - L) * 0.382)
Second Support (S2): PP - ((H - L) * 0.618)
Third Support (S3): PP - ((H - L) * 1.000)
These pivot point calculations help traders identify potential support and resistance levels, enabling more informed decision-making in their trading strategies.
🔵 How to Use
🟣 Two Methods for Trading Pivot Points
There are two primary methods for trading pivot points: trading with "pivot point breakouts" and trading with "price reversals."
🟣 Pivot Point Breakout
A breakout through pivot lines provides a significant signal to the trader, indicating a change in market sentiment. When an upward breakout occurs and the price crosses these lines, a trader can enter a long position and place their stop-loss below the pivot point (P).
Similarly, if a downward breakout happens, a short order can be placed below the pivot point.
When trading with pivot point breakouts, if the upward trend breaks, the first and second support levels can be the trader's profit targets. In a downward trend, the first and second resistance levels will serve this role.
🟣 Price Reversal
Another method for trading pivot points is waiting for the price to reverse from the support and resistance levels. To execute this strategy, one should trade in the opposite direction of the trend as the price reverses from the pivot point.
It's worth noting that although traders use this tool in higher time frames, it yields better results in shorter time frames such as one-hour, 30-minute, and 15-minute intervals.

Pivot PointsDescription:
The Pivot Point indicator is designed to identify potential entry and exit points based on pivot points and manually tracks the average entry price and position size without executing actual trades, allowing for a visual simulation of pyramiding strategies.
Inputs for Customization:
i_leverage: User-defined leverage for trades.
i_takeProfit: Percentage for taking profit, adjusted by leverage.
i_dca: Percentage for dollar-cost averaging (DCA) when the price is a certain percentage below the entry, adjusted by leverage.
i_pivotFactor: Factor used to calculate the entry price from the pivot points.
i_pivotLength: The length of the lookback period to calculate the highest and lowest pivot points.
Usage Tips:
This indicator can be use by itself to provide entry and exit signals based on pivot points that will be generated from the provided `Pivot Factor`. An input of 1 will be the same as no factor.
This indicator can also be used as an input source for other indicators to facilitate other ideas.
Pivot Points High LowGaneshA Pivot Points High/Low indicator that:
Detects swing highs (ta.pivothigh) and swing lows (ta.pivotlow) using configurable left/right bar lengths.
Draws labels at the confirmed pivot points:
Down labels at pivot highs (potential resistance).
Up labels at pivot lows (potential support).
Lets you customize text color and label fill color separately for highs and lows.
It’s designed for overlay (on-price chart), with max_labels_count=500 to allow many labels.

Pivot Points - [RealFact]Description:
The Pivot Points indicator is a powerful tool for identifying potential support and resistance levels based on previous price action. It calculates key pivot levels (P), along with support (S1, S2) and resistance (R1, R2) levels, which are used to forecast potential turning points in the market.
Key Features:
Pivot Calculation: Based on the previous period's high, low, and close prices.
Support and Resistance Levels: Three support (S1, S2) and three resistance (R1, R2) levels.
Customizable Timeframes: Applicable to various timeframes including daily, weekly, and monthly charts.
Visual Representation: Levels are clearly plotted on the chart, making it easy to identify key areas.
Trading Strategies: Useful for breakout, reversal, and trend-following strategies.
How to Use:
Identify Key Levels: Use the pivot point (P) to determine the general market trend.
Support and Resistance: Look for price reactions at S1, S2, R1 and R2 to find potential entry and exit points.
Combine with Other Indicators: Enhance analysis by combining with other technical indicators such as Moving Averages, RSI, or MACD.
Formula:
Pivot Point (P) = (High + Low + Close) / 3
Support 1 (S1) = 2P - High
Resistance 1 (R1) = 2P - Low
Support 2 (S2) = P - (High - Low)
Resistance 2 (R2) = P + (High - Low)
Best Practices:
Confirm with Volume: Look for volume confirmation when price approaches pivot levels.
Avoid False Breakouts: Be cautious of false breakouts and use other indicators to confirm price moves.

Pivot Points High Low - JVersion**Indicator Name**: Pivot Points High Low (Without Price Labels)
**Overview**
The Pivot Points High Low indicator is designed to identify and mark local highs and lows (or “pivot” points) on a price chart. Unlike other pivot-based indicators that label each pivot with its exact price, this version displays only small circular markers—removing clutter and focusing attention on the pivot locations themselves.
**Key Features**
1. **Pivot Detection**
- The script uses TradingView’s built-in `ta.pivothigh()` and `ta.pivotlow()` functions to determine when the market has formed a pivot high or pivot low.
- You can define how many bars to the left and right are required to confirm a pivot, helping you tailor the indicator to different market conditions and timeframes.
2. **Clean Markers**
- Each confirmed pivot high or low is represented by a circle placed precisely on the candle where the pivot is detected.
- No numeric labels are shown, keeping your chart visually uncluttered while still highlighting important turning points in price.
3. **Customization**
- **Left/Right Pivot Length**: Choose how many bars to the left and right must be lower (for highs) or higher (for lows) to validate a pivot. Larger values mean fewer but more significant pivots; smaller values mean more frequent pivots.
- **Marker Colors**: Independently customize the colors of the high-marker circles and low-marker circles to easily distinguish between local tops and bottoms.
4. **Usage and Interpretation**
- **Identifying Reversals**: As soon as a circle appears at a local high or low, it may indicate a short-term trend reversal or the beginning of a new swing in price.
- **Combine with Other Tools**: Pivot points are more informative when used alongside broader trend analysis, support/resistance identification, or other momentum indicators.
- **Adjusting Sensitivity**: By increasing or decreasing the left/right pivot lengths, you can make the indicator more or less sensitive to small market fluctuations.
5. **Practical Tips**
- **Swing Trading**: Shorter lengths can be used by swing traders looking for quick reversals in lower timeframes.
- **Longer-Term Trends**: Larger lengths are better for position traders or those who prefer to see only major turning points in the market.
- **Clean Chart Layout**: Because text labels are removed, you can visually focus on the circles—especially helpful if you use multiple indicators and prefer a less cluttered chart.
---
By pinpointing local highs and lows without price labels, the **Pivot Points High Low** indicator keeps charts neat yet informative, allowing traders to quickly recognize potential turning points in the market and make more informed decisions.
Pivot PointsPivot Points Indicator
The Pivot Points indicator highlights areas on the chart where candles close in opposite colors. These points occur when the price shifts from bullish to bearish, or vice versa, indicating potential reversals or continuation patterns. These points are more easily seen on a line chart and represent areas where the price changes direction to create peak formations.
Foundational Concepts
Before diving into the indicator, it’s important to understand a few key concepts:
When price is trending upward, it creates higher highs and higher lows. Each high or low acts as a pivot point. In an uptrend, the price is more likely to break the previous high (pivot point) and continue higher. You can enter a buy trade when the price breaks the previous high, anticipating the continuation of the trend.
When price is trending downward, it creates lower lows and lower highs. Each high or low is also a pivot point. In a downtrend, the price is more likely to break the previous low (pivot point) and continue lower. You can enter a sell trade when the price breaks the previous low, anticipating the continuation of the trend.
For reversal trades, it’s helpful to be familiar with chart patterns like double tops, double bottoms, and head and shoulders. The Pivot Points indicator can assist in identifying these patterns, helping you determine entry points, as well as where to place your stop loss.
Recommended Setup
It’s recommended to have two charts open side by side: one displaying a line chart and the other showing a candlestick chart, with the Pivot Points indicator applied to both. This setup allows you to easily identify the market structure and price action as it approaches these levels. You can also add a 20-period Simple Moving Average (SMA) to both charts to help identify the overall trend. Additionally, consider adding the Relative Strength Index (RSI) to the line chart to confirm overbought or oversold conditions.
This approach can be used on any timeframe.
Contributing
If you have suggestions, improvements, or bug fixes, I encourage you to submit pull requests. Collaboration helps make the indicator more versatile and useful for everyone.
Disclaimer
Any trading decisions you make are entirely your responsibility.
The MetaTrader 5 version of this indicator is available on my GitHub repository: roshaneforde/pivot-points-indicator
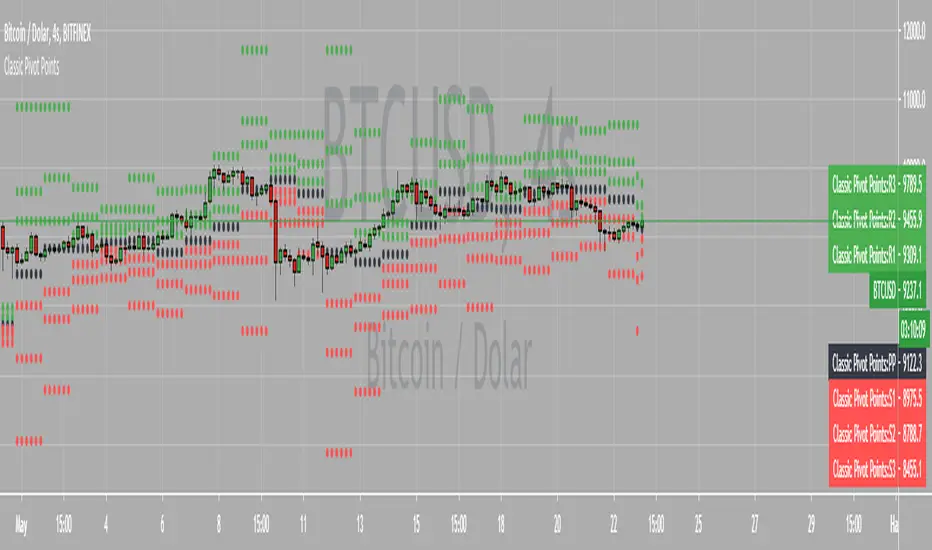
K's Pivot PointsPivot points are a popular technical analysis tool used by traders to identify potential levels of support and resistance in a given timeframe. Pivot points are derived from previous price action and are used to estimate potential price levels where an asset may experience a reversal, breakout, or significant price movement.
The calculation of pivot points involves a simple formula that takes into account the high, low, and close prices from the previous trading session or a specific period. The most commonly used pivot point calculation method is the "Standard" or "Classic" method. Here's the formula:
Pivot Point (P) = (High + Low + Close) / 3
In addition to the pivot point itself, several support and resistance levels are calculated based on the pivot point value.
K's Pivot Points try to enhance them by incorporating multiple elements and by applying a re-integration strategy to validate two events:
* Found_Support: This event represents a basing market that is bound to recover or at least shape a bounce.
* Found_Resistance: This event represents a toppish market that is bound to consolidate or at least shape a pause.
K's Pivot Points are calculated following these steps:
1. Calculate the highest of highs for the previous 24 periods (preferably hours).
2. Calculate the lowest of lows for the previous 24 periods (preferably hours).
3. Calculate a 24-period (preferably hours) moving average of the close price.
4. Calculate K's Pivot Point as the average between the three previous step.
5. To find the support, use this formula: Support = (Lowest K's pivot point of the last 12 periods * 2) - Step 1
6. To find the resistance, use this formula: Resistance = (Highest K's pivot point of the last 12 periods * 2) - Step 2
The re-integration strategy to find support and resistance areas is as follows:
* A support has been found if the market breaks the support and shapes a close above it afterwards.
* A resistance has been found if the market surpasses the resistance and shapes a close below it afterwards.
The lookback period (whether 24 and 12) can be modified but the default versions work well.
